Picture this situation: You’re approaching a deadline fast, and you’re using every spare minute to achieve your goal of finishing this complex refactoring, with plenty of changes in your CSS files. You’re even working on the last steps during your bus ride. However, your local tests seem to fail every time, and you can’t get them to work. Your stress level is rising.
There is indeed a similar scene in a well-known series: It’s from the third season of Netflix’s TV series, “How to Sell Drugs Online (Fast)”:
🤯Cypress + Vue is featured *ON A NETFLIX TV SHOW*
It’s a comedy called “How to sell drugs (fast)” and it has some of the most realistic depictions of webdev.
Season 3, Episode 1 @ 20:20 and once or twice before that. pic.twitter.com/ICSAwMxyFB
— jess (@_jessicasachs) August 7, 2021
Well, he’s using tests at least, you might think. Why is he still in distress, you might wonder? There’s still much room for improvement and to avoid such a situation, even if you write tests. How do you think about monitoring your codebase and all your changes from the start? As a result, you won’t experience such nasty surprises, right? It’s not too difficult to include such automated testing routines: Let’s create this testing pipeline together from start to finish.
Let’s go! 🙌
First Things First: Basic Terms
A building routine can help you stay confident in more complex refactoring, even in your small side projects. However, that doesn’t mean you need to be a DevOps engineer. It’s essential to learn a couple of terms and strategies, and that’s what you’re here for, right? Fortunately, you’re in the right spot! Let’s start with the fundamental terms you will encounter soon when dealing with a testing pipeline for your front-end project.
If you google your way through the world of testing in general, it may happen you already stumbled upon the terms “CI/CD” as one of the first terms. It’s short for “Continuous Integration, Continuous Delivery” and “Continuous Deployment” and describes exactly that: As you probably have heard already, it’s a software distribution method used by development teams to deploy code changes more frequently and reliably. CI/CD involves two complementary approaches, which rely heavily on automation.
- Continuous Integration
It’s a term for automation measures to implement small, regular code changes and merge them into a shared repository. Continuous integration includes the steps of building and testing your code.
CD is the acronym for both “Continuous Delivery” and “Continuous Deployment,” which are both concepts being similar to each other but sometimes used in different contexts. The difference between both lies in the scope of automation:
- Continuous Delivery
It refers to the process of your code that was already being tested before, from where the operations team can now deploy them in a live production environment. This last step may be manual though. - Continuous Deployment
It focuses on the “deployment” aspect, as the name implies. It’s a term for the fully automated release process of developer changes from the repository right to production, where the customer can use them directly.
Those processes aim to enable developers and teams to have a product, which you could release at any time if they wanted to: Having the confidence of a continuously monitored, tested, and deployed application.
To achieve a well-designed CI/CD strategy, most people and organizations use processes called “pipelines”. “Pipeline” is a word we already used in this guide without explaining it. If you think about such pipelines, it’s not too far-fetched to think about tubes serving as long-distance lines to transport such things as gas. A pipeline in the DevOps area functions quite similarly: They are “transporting” software to deploy.

Wait that sounds like lots of things to learn and remember, right? Didn’t we talk about testing? You’re right on that one: Covering the complete concept of a CI/CD pipeline will provide enough content for multiple articles, and we want to take care of a testing pipeline for small front-end projects. Or you’re only missing the testing aspect of your pipelines, thus being focused on continuous integration processes alone. So, in particular, we will focus on the “Testing” part of pipelines. Therefore, we will create a “small” testing pipeline in this guide.
Alright, so the “testing part” is our main focus. In this context, which tests do you know already and come to your mind at first glance? If I think about testing this way, these are the types of testing I spontaneously think of:
- Unit testing is a kind of test in which minor testable parts or units of an application, called units, are individually and independently tested for proper operation.
- Integration Testing has a focus on the interaction between components or systems. This kind of testing means we’re checking the interplay of the units and how they’re working together.
- End-To-End Testing, or E2E testing, means that actual user interactions are simulated by the computer; in doing so, E2E testing should include as many functional areas and parts of the technology stack used in the application as possible.
- Visual Testing is the process of checking the visible output of an application and comparing it to the expected results. Put another way, it helps find “visual bugs” in the appearance of a page or screen different from purely functional bugs.
- Static analysis is not precisely testing, but I think it’s essential to mention it here. You can imagine it working like a spelling correction: It debugs your code without running the program and detects code style issues. This simple measure can prevent many bugs.
To be confident in merging a massive refactoring in our unique project, we should consider using all of these testing types in our testing pipeline. But head-starting leads to frustration fast: You might feel lost evaluating these testing types. Where should I start? How many tests of which types are reasonable?
Strategizing: Pyramids And Trophies
We need to work on a testing strategy before diving into building our pipeline. Searching for answers to all those questions before, you might find a possible solution in some metaphors: In the web and in testing communities specifically, people tend to use analogies to give you an idea of how many tests you should use of which type.
The first metaphor you’ll probably run into is the test automation pyramid. Mike Cohn came up with this concept in his book “Succeeding with Agile”, further developed as “Practical Test Pyramid” by Martin Fowler. It looks like this:
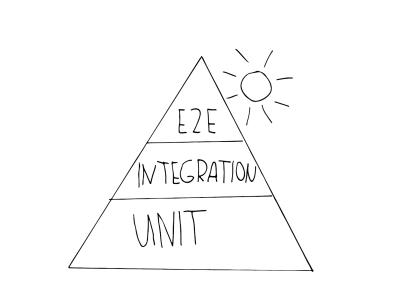
As you see, it consists of three levels, which correspond to the three test levels presented. The pyramid is intended to clarify the right mix of different tests, to guide you while developing a test strategy:
- Unit
You find these tests on the base layer of the pyramid because they are fast execution and simple to maintain. This is due to their isolation and the fact they target the smallest units. See this one for an example of a typical unit test testing a very small product. - Integration
These are in the middle of the pyramid, as they are still acceptable when it comes to speed in execution but still bring you the confidence of being closer to the user than unit tests can be. An example of a test of integration type is an API test, also component tests can be considered this type. - E2E tests (also called UI tests)
As we saw, these tests simulate a genuine user and their interaction. These tests need more time to be executed and thus are more expensive — being placed at the top of the pyramid. If you want to inspect a typical example for an E2E test, head over to this one.
However, over recent years this metaphor felt out of time. One of its flaws, in particular, is crucial for me: static analyses are bypassed in this strategy. The usage of code-style fixers or other linting solutions is not considered in this metaphor, being a huge flaw, in my opinion. Lint and other static analysis tools are an integral part of the pipeline in use and shouldn’t be ignored.
So, let’s cut this short: we should use a more updated strategy. But missing linting tools is not the only flaw — there’s even a more significant point to consider. Instead, we might shift our focus slightly: the following quote sums it up quite good:
“Write tests. Not too many. Mostly integration.”
— Guillermo Rauch
Let’s break down this quote to learn about it:
- Write tests
Quite self-explanatory — you should always write tests. Tests are crucial to instill trust inside your application — for users and developers alike. Even for yourself! - Not too many
Writing tests at random will not get you anywhere; the testing pyramid is still valid in its statement to keep tests prioritized. - Mostly integration
A trump card of the more “expensive” tests that the pyramid ignores is that the confidence in the tests increases as far you move up the pyramid. This increase means both the user and yourself as a developer are most likely to trust those tests.
This means we should go for tests that are closer to the user, by design. As a result, you might pay more, but you get a lot of value back. You might wonder why not choose the E2E test? As they are mimicking users, aren’t they the closest to the user, to begin with? This is true, but they are still much slower to execute and require the full application stack. So this return of investment is later achieved than with integration tests: Consequently, integration tests offer a fair balance between trust on the one hand and speed and effort on the other.
If you follow Kent C.Dodds, these arguments may sound familiar to you, especially if you read this article by him in particular. These arguments are no coincidence: He came up with a new strategy in his work. I strongly agree with his points and link the most important one here and others in the resource section. His suggested approach stems from the testing pyramid but lifts it to another level by changing its shape to reflect the higher priority on integration tests. It’s called the “Testing Trophy”.
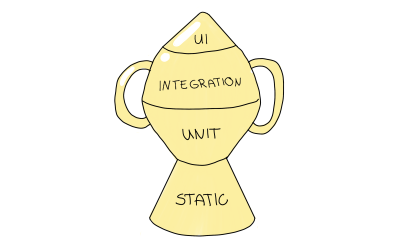
The testing trophy is a metaphor depicting the granularity of tests in a slightly different way; you should distribute your tests into the following testing types:
- Static analysis plays a vital role in this metaphor. This way, you will catch typos, type errors, and other bugs by merely running mentioned debugging steps.
- Unit Tests should ensure that your smallest unit is appropriately tested, but the testing trophy won’t emphasize them to the same extent as the testing pyramid.
- Integration is the main focus as it balances out the cost and the higher confidence the best way.
- UI tests, including E2E and Visual tests, are at the top of the testing trophy, similar to their role in the testing pyramid.
I went for this testing trophy strategy in most of my projects, and I’ll continue to do so in this guide. However, I need to give a little disclaimer here: Of course, my choice is based on the projects I’m working on in my daily living. Thus, the benefits and selection of a matching testing strategy are always dependent on the project you’re working on. So, don’t feel bad if it doesn’t fit your needs, I’ll add resources to other strategies in the corresponding paragraph.
Minor spoiler alert: In a way, I will need to deviate from this concept a little bit as well, as you will see soon. However, I think that’s fine, but we’ll get to that in a bit. My point is to think about the prioritization and distribution of testing types before planning and implementing your pipelines.
How To Build Those Pipelines Online (Fast)
The protagonist in the third season of Netflix’s TV series “How To Sell Drugs Online (Fast)” is shown using Cypress for E2E testing while close to a deadline, however, it was really only local testing. No CI/CD was to be seen, which caused him unnecessary stress. We should avoid the given protagonist’s pressure in the corresponding episodes with the theory we learned. However, how can we apply those learnings to reality?
First of all, we need a codebase as a test basis to begin with. Ideally, it should be a project many of us front-end developers will encounter. Its use case should be a frequent one, being well-suited for a hands-on approach and enabling us to implement a testing pipeline from scratch. What could such a project be?
My Suggestion Of A Primary Pipeline
The first thing that came to my mind was self-evident: My website, i.e., my portfolio page, is well suited to be considered an example codebase to be tested by our aspiring pipeline. It’s published open-source on Github, so you can view it and use it freely. A few words about the site’s tech stack: Basically, I built this site on Vue.js (unfortunately still on version 2 when I wrote this article) as a JavaScript framework with Nuxt.js as an additional web framework. You can find the complete implementation example in its GitHub repository.
With our example codebase selected, we should start to apply our learnings. Given the fact we want to use the testing trophy as a starting point for our test strategy, I came up with the following concept:
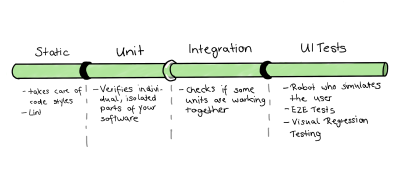
As we’re dealing with a relatively small codebase, I’ll merge the parts of Unit and Integration tests. However, that’s just one little reason for doing that. Other and more important reasons are those:
- The definition of a unit is often “to be discussed”: If you ask a group of developers to define a unit, you will mostly get various, differing answers. As some refer to a function, class, or service — minor units — another developer will count in the complete component.
- In addition to those definition struggles, drawing a line between unit and integration can be tricky, as it’s very blurry. This struggle is real, especially for Frontend, as we often need the DOM to validate the test basis successfully.
- It’s usually possible to use the same tools and libraries to write both integration tests. So, we might be able to save resources by merging them.
As we know what we want to picture inside a pipeline, next up is the choice of continuous integration and delivery (CI/CD) platform. When choosing such a platform for our project, I think about those I already gained experience with:
However, there are many other platforms to choose from. I would suggest always basing your choice on your projects and their specific requirements, considering the technologies and frameworks used — so that compatibility issues will not occur. Remember, we use a Vue 2 project that was already released on GitHub, coincidentally matching my prior experience. In addition, the mentioned GitHub Actions need only the GitHub repository of your project as a starting point; to create and run a GitHub Actions workflow specifically for it. As a consequence, I’ll go with GitHub Actions for this guide.
So, those GitHub actions provide you a platform to run specifically defined workflows if some given events are happening. Those events are particular activities in our repository that trigger the workflow, e.g., pushing changes to a branch. In this guide, those events are tied to CI/CD, but such workflows can automate other workflows like adding labels to pull requests, too. GitHub can execute them on Windows, Linux, and macOS virtual machines.
To visualize such a workflow, it would look like this:

In this article, I will use one workflow to picture one pipeline; this means one workflow will contain all of our testing steps, from Static Analysis to UI tests of all kinds. This pipeline, or called “workflow” in the following paragraphs, will consist of one or even more jobs, which are a set of steps being executed on the same runner.
This workflow is exactly the structure I wanted to sketch in the drawing above. In it, we take a closer look at such a runner containing multiple jobs; The steps of a job themself are made of different steps. Those steps can be one of two types:
- A step can run a simple script.
- A step can be able to run an action. Such action is a reusable extension and is often a complete, custom application.
Keeping this in mind, an actual workflow of a GitHub action looks like this:

Writing Our Very First GitHub Action
Finally, we can write our first own Github action and write some code! We will begin with our basic workflow and our first outline of the jobs we want to depict. Remembering our testing trophy, every job will be resembling one layer in the testing trophy. The steps will be the things we need to do to automate those layers.
Therefore, I create the .github/workflows/ directory to store our workflows first. We will create a new file called tests.yml to contain our testing workflow inside this directory. Alongside the standard workflow syntax seen in the drawing above, I’ll proceed as follows:
- I’ll name our workflow
Tests CI. - Because I want to execute my workflow on every push to my remote branches and provide a manual option to start my pipeline, I will configure my workflow to run on
pushandworkflow_dispatch. - Last but not least, as stated in the paragraph “My suggestion of a basic pipeline”, my workflow will contain three jobs:
static-eslintfor static analysis;unit-integration-jestfor unit and integration testing merged in one job;ui-cypressas UI stage, including basic E2E test and visual regression testing.
- A Linux-based virtual machine should execute all jobs, so I’ll go with
ubuntu-latest.
Put in the correct syntax of a YAML file, the first outline of our workflow might look like this one:
name: Tests CI
on: [push, workflow_dispatch] # On push and manual
jobs: static-eslint: runs-on: ubuntu-latest steps: # 1 steps unit-integration-jest: runs-on: ubuntu-latest steps: # 1 step ui-cypress: runs-on: ubuntu-latest steps: # 2 steps: e2e and visual
If you want to dive into details about workflows in GitHub action, feel free to head over to its documentation at any time. Either way, you are undoubtedly aware that the steps are still missing. Don’t worry — I’m aware, too. So to fill this workflow outline with life, we need to define those steps and decide which testing tools and frameworks to use for our small portfolio project. All upcoming paragraphs will describe the respective jobs and contain several steps to make the automation of said tests possible.
Static Analysis
As the testing trophy suggests, we will begin with linters and other code-style fixers in our workflow. In this context, you can choose from many tools, and some examples include those:
- Eslint as a Javascript code style fixer.
- Stylelint for CSS code fixing.
- We can consider going even further, e.g., to analyze code complexity, you could look at tools like scrutinizer.
Those tools have in common that they point out errors in patterns and conventions. However, please be aware that some of those rules are a matter of taste. It’s up to you to decide how strict you want to enforce them. To name an example, if you’re going to tolerate an indentation of two or four tabs. It’s much more important to focus on requiring a consistent code style and catching more critical causes of errors, like using “==” vs. “===”.
For our portfolio project and this guide, I want to start installing Eslint, as we’re using a lot of Javascript. I’ll install it with the following command:
npm install eslint --save-dev
Of course, I can also use an alternative command with the Yarn package manager if I prefer not to use NPM. After installation, I need to create a configuration file called .eslintrc.json. Let’s use a basic configuration for now, as this article won’t teach you how to configure Eslint in the first place:
{ "extends": [ "eslint:recommended", ]
}
If you want to learn about Eslint configuration in detail, head over to this guide. Next, we want to do our first steps to automate the execution of Eslint. To begin with that, I want to set the command to execute Eslint as an NPM script. I achieve this by using this command in our package.json file in the script section:
"scripts": { "lint": "eslint --ext .js .",
},
I can then execute this newly created script in our GitHub workflow. However, we need to make sure our project is available before doing that. Therefore we use the preconfigured GitHub Action actions/checkout@v2 which does exactly that: Checking out our project, so your GitHub action’s workflow can access it. The next step would be installing all NPM dependencies we need for my portfolio project. After that, we’re finally ready to run our eslint script! Our final job to use linting looks like this now:
static-eslint: runs-on: ubuntu-latest steps:
# Action to check out my codebase - uses: actions/checkout@v2
# install NPM dependencies - run: npm install
# Run lint script - run: npm run lint
You might wonder now: Does this pipeline automatically “fail” when our npm run lint in a failing test? Yes, this does work out of the box. As soon as we’re finished writing our workflow, we will look at the screenshots on Github.
Unit And Integration
Next, I want to create our job containing the unit and integration steps. Regarding the framework used in this article, I would like to introduce you to the Jest framework for frontend testing. Of course, you don’t need to use Jest if you don’t want to — there are many alternatives to choose from:
- Cypress also provides component testing to be well-suited for integration tests.
- Jasmine is another framework to take a look at as well.
- And there are many more; I just wanted to name a few.
Jest is provided as open-source by Facebook. The framework credits its focus on simplicity while being compatible with many JavaScript frameworks and projects, including Vue.js, React, or Angular. I‘m also able to use jest in tandem with TypeScript. This makes the framework very interesting, especially for my small portfolio project, as it’s compatible and well-suited.
We can directly start installing Jest from this root folder of my portfolio project by entering the following command:
npm install --save-dev jest
After installation, I’m already able to start to write tests. However, this article focuses on automating these tests by using Github actions. So, to learn how to write a unit or integration test, please refer to the following guide. When setting up the job in our workflow, we can proceed similarly to the static-eslint job. So, first step is again creating a small NPM script to use in our job later on:
"scripts": { "test": "jest",
},
Afterward, we will define the job called unit-integration-jest similarly to what we already did for our linters before. So, the workflow will check out our project. In addition to that, we will use two slight differences to our first static-eslint job:
- We will use an action as a step to install Node.
- After that, we will use our newly created npm script to run our Jest test.
This way, our unit-integration-jest job will look like this::
unit-integration-jest: runs-on: ubuntu-latest steps: - uses: actions/checkout@v2
# Set up node - name: Run jest uses: actions/setup-node@v1 with: node-version: '12' - run: npm install
# Run jest script - run: npm test
UI Tests: E2E And Visual Testing
Last but not least, we will write our ui-cypress Job, which will contain both E2E testing and visual testing. It’s clever to combine those two in one job as I’ll use the Cypress framework for both. Of course, you can consider other frameworks like those below, NightwatchJS and CodeceptJS.
Again, we’ll cover only the basics to set it up in our GitHub workflow. If you want to learn how to write Cypress tests in detail, I got you covered with another of my guides tackling precisely that. This article will guide you through anything we need to define our E2E testing steps. Alright, first we’ll install Cypress, the same way we did with the other frameworks, using the following command in our root folder:
npm install --save-dev cypress
This time, we don’t need to define an NPM script. Cypress already provides us with its own GitHub action to use, cypress-io/github-action@v2. In there, we only need to configure some things to get it running:
- We need to make sure our application is fully set up and working, as an E2E test needs the complete application stack available.
- We need to name the browser we’re running our E2E test inside.
- We need to wait for the webserver to be fully functioning, so the computer can behave like a real user.
Fortunately, our Cypress action helps us store all those configurations with the with area. This way, our current GitHub job looks this way:
steps: - name: Checkout uses: actions/checkout@v2 # Install NPM dependencies, cache them correctly # and run all Cypress tests - name: Cypress Run uses: cypress-io/github-action@v2 with: browser: chrome headless: true # Setup: Nuxt-specific things build: npm run generate start: npm run start wait-on: 'http://localhost:3000'
Visual Tests: Lend Some Eyes To Your Test
Remember our first intention to write this guide: I have my significant refactoring with plenty of changes in SCSS files — I want to add testing as a part of the build routine to make sure that didn’t break anything else. Having static analysis, unit, integration, and E2E tests, we should be pretty confident, right? True, but there’s still something I can do to make my pipeline even more bulletproof and perfect. You could say it is becoming the creamer. Especially when dealing with CSS refactoring, an E2E test can only be of limited help, as it only does the thing you said it to do by writing it down in your test.
Fortunately, there’s another way of catching bugs apart from the written commands and, thus, apart from the concept. It’s called visual testing: You can imagine this kind of testing to be like a spot-the-difference puzzle. Technically speaking, visual testing is a screenshot comparison that will take screenshots of your application and compare it to the status quo, e.g., from the main branch of your project. This way, no accidental styling issue will go unnoticed — at least in areas where you use Visual testing. This can turn Visual testing into a lifesaver for large CSS refactorings, at least in my experience.
There are many visual testing tools to choose from and are worth a look at:
For this guide and basically for my portfolio project, it was vital to reuse my existing Cypress tests for visual testing. As mentioned before, I’ll use Percy for this example due to its simplicity of integration. Although it is a SaaS solution, there are still many parts provided open-source, and there’s a free plan which should be sufficient for many open source- or other side projects. However, if you feel more comfortable going fully self-hosted while using an open-source tool as well, you may give the Visual Regression Tracker a shot.
This guide will give you only a brief overview of Percy, which would otherwise provide content for an entirely new article. However, I’ll give you the information to get you started. If you want to dive into details now, I recommend looking at Percy’s documentation. So, how can we give our tests eyes, so to say? Let’s assume we’re already written one or two Cypress tests by now. Imagine them to look like this:
it('should load home page (visual)', () => { cy.get('[data-cy=Polaroid]').should('be.visible'); cy.get('[data-cy=FeaturedPosts]').should('be.visible');
});
Sure, if we want to install Percy as our visual testing solution, we can do that with a cypress plugin. So, as we did a couple of times today, we’re installing it in our root folder by using NPM:
npm install --save-dev @percy/cli @percy/cypress
Afterward, you only need to import the percy/cypress package to your cypress/support/index.js index file:
import '@percy/cypress';
This import will enable you to use Percy’s snapshot command, which will take a snapshot from your application. In this context, a snapshot means a collection of screenshots taken from different viewports or browsers you can configure.
it('should load home page (visual)', () => { cy.get('[data-cy=Polaroid]').should('be.visible'); cy.get('[data-cy=FeaturedPosts]').should('be.visible'); // Take a snapshot cy.percySnapshot('Home page'); });
Coming back to our workflow file, I want to define Percy testing as the second step of the job. In it, we will run the script npx percy exec -- cypress run to run our test together with Percy. To connect our tests and results to our Percy project, we’ll need to pass our Percy token, hidden by a GitHub secret.
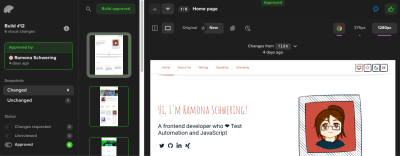
steps: # Before: Checkout, NPM, and E2E steps - name: Percy Test run: npx percy exec -- cypress run env: PERCY_TOKEN: ${{ secrets.PERCY_TOKEN }} Why do I need a Percy token? It’s because Percy is a SaaS solution for maintaining our screenshots. It will keep the screenshots and the status quo for comparison and provide us with a screenshot approval workflow. In there, you can approve or reject any upcoming change:
Viewing Our Works: GitHub Integration
Congratulations! We were successfully building our very first GitHub action workflow. 🎉 Let’s take a final look at our complete workflow file in my portfolio page’s repository. Don’t you wonder how it looks in practical usage? You can find your working GitHub actions in the “Actions” tab of your repository:
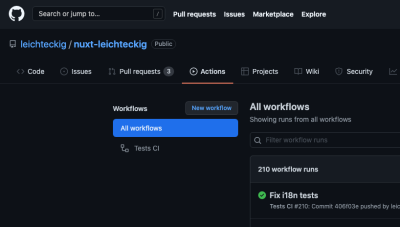
In there, you can find all workflows, which are equivalent to your workflow files. If you take a look at one workflow, e.g., my “Tests CI” workflow, you can inspect all jobs of it:
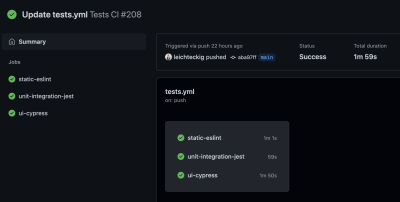
If you’d like to take a look at one of your job, you can select it in the sidebar, too. In there, you‘re able to inspect the log of your jobs:
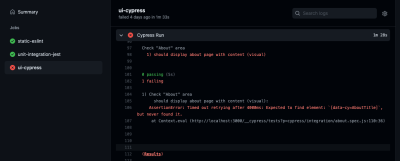
You see, you’re able to detect errors if they happen inside of your pipeline. By the way, the “action” tab is not the only place you can check the results of your GitHub actions. You can inspect them in your pull requests, too:

I like to configure those GitHub actions the way they need to be executed successfully: Otherwise, it’s not possible to merge any pull requests into my repository.
Conclusion
CI/CD helps us perform even major refactorings — and dramatically minimizes the risk of running into nasty surprises. The testing part of CI/CD is taking care of our codebase being continuously tested and monitored. Consequently, we will notice errors very early, ideally before anyone merges them into your main branch. Plus, we will not get into the predicament of correcting our local tests on the way to work — or even worse — actual errors in our application. I think that’s a great perspective, right?
To include this testing build routine, you don’t need to be a full DevOps engineer: With the help of some testing frameworks and GitHub actions, you’re able to implement these for your side projects as well. I hope I could give you a short kick-off and got you on the right track.
I’m looking forward to seeing more testing pipelines and GitHub action workflows out there! ❤️
