
All the data in the world won’t do anyone any good if we can’t make sense of it. Or better yet, make it sing. Here are some stunning examples of data visualization in the wild, and some pointers on how to start making your own.
They say we are entering the Data Age. There’s certainly enough of the stuff about. Between analytics, public records, and the slow yet steady growth of the Semantic Web, millions of data points are at our fingertips, just waiting to have their stories told.
Telling captivating stories with data is easier said than done. Spreadsheets don’t exactly get hearts singing. Big pieces of JSON don’t inspire so much as they horrify. It doesn’t need to be that way, though. Data can dance. Data should dance.
Part Of: Web Design Done Well
This edition of Web Design Done Well showcases magnificent examples of data visualization on the web, and closes with some of the countless resources available to those who want to learn to make their own. From wind maps to the seven terraces of Mount Purgatory, data visualization can take you to some remarkable places.
Wind Map
Data doesn’t have to be dusty and boring — it can be vibrant and alive. This Wind Map showing wind patterns in the US is a stunning example of how data can transcend spreadsheets and become something beautiful. More importantly, it’s intuitive to understand, a true mark of quality data visualization. Thicker, faster lines equate to stronger winds. Simple. It makes for a stunning at-a-glance picture, with more granular detail available by hovering and zooming.

The site is a testament to the importance of publically available data (this will be a running theme in this article). The numbers are pulled through from the National Digital Forecast Database which is updated hourly. As creators Fernanda Viégas and Martin Wattenberg put it, this makes Wind Map a “living portrait” of wind patterns in the contiguous United States.
DivineComedy.digital
Data visualization isn’t just about showing information — it’s about showing the connections between information. DivineComedy.digital is a “digital humanities tool” which shows how Dante’s Divine Comedy has manifested itself in the art across the seven centuries since it was published.

The sections of the book have been broken down into chapters, and the chapters into passages. Each contains a wealth of artworks inspired by the text — from over 70 museums by more than 90 authors. The project is a testament to Dante’s original work, the works it has since inspired, and the power of digital tools to capture the true interconnectedness of things.
The Linked Open Data Cloud
Speaking of the interconnectedness of things, here’s something I became aware of while researching the Semantic Web a couple of years ago. The Linked Open Data Cloud visualizes more that 16,000 links between 1,300 data sources on the Web.

Maintained by John Philip McCrae for the Insight Centre for Digital Analytics, the graph is built using LOD Cloud Draw. (Though D3’s force-directed graph is perhaps a more mainstream equivalent.) The LODC has come a long way since starting with 12 datasets in 2007.

For those interested in learning more about linked data, DPpedia is a fine place to start. Data visualization tools aren’t much good without data to work their magic on, so networks like this (and the ethos of openness and sharing behind them) are vital.
United Nations Refugee Project
I hope you’ve noticed a common theme so far. Data visualization carries extra weight when it has purpose — when it’s more than just something nice to look at. The magic of data visualization is that it can take complex data sets about complex topics and present them in ways that almost anyone can understand. Data visualization can tell stories no other medium can. This stream chart of refugee movement in the 20th and 21st century is a stunning example of that — packed with information yet accessible and clear.

This was commissioned by the United Nations Refugee Agency and masterminded by the brilliant Curran Kelleher (more on him later). You can almost see the ebb and flow of a crowd of millions. It’s powerful stuff, and just as importantly, it hasn’t watered down the subject matter. Instead, it has brought it to life.
Financial Times’ Covid Chart
Sometimes only a line chart will do. The Financial Times data visualization team knocked it out of the park with their tracking of Covid infections, which became a major point of reference during the early days of the pandemic. It is a true team effort, the culmination of work by developers, designers, and reporters.
Something I especially like about this example of data visualization is the amount of space dedicated to methodology and sources. It takes the time to explain the data and why it’s presented the way it is. Very occasionally these decisions speak for themselves, but it’s best to default to transparency. Give readers the full context.
Data visualization can be beautiful. Well documented data visualization is even better.
Singapore’s Open Data
Data dashboards have become a lynchpin of the modern web. Singapore’s data.gov.sg is an especially good example of a government making data not just publically available, but readable too. It’s a vast, explorable data dashboard — one we can all learn from, both in terms of design and accessibility.

With almost 2,000 data sets on subjects ranging from property prices to short story programmes, the site feels like a virtual library. Browsing is easy and intuitive. The data is accessible in every sense of the word, trying to live up to its own data sharing principles:
- data shall be made easily accessible;
- data shall be made available for co-creation;
- data shall be released in a timely manner;
- data shall be shared in machine-readable format;
- data shall be as raw as possible.
Hear, hear.
The Pudding Explores The Pitch Of Pop Music
It’s a question that keeps all of us awake at night — are men singing at a higher pitch in pop music than they used to? Luckily, this project by data viz magicians The Pudding gives us the answer. Are Men Singing Higher in Pop Music? uses vocal register data from Pandora to find the average pitch of every song featured in the Billboard Hot 100 since 1958. No, really. They did.

What on the surface may seem a silly (if fun) idea quickly unfolds into a fascinating exploration of music trends, weaving together audio, video, and god honest line graphs into one colorful package.
The piece is also an (admittedly inverted) glimpse into the possibilities of data sonification, a concept hauntingly realized by data journalist Simon Huwiler with his covid deaths music box.
Solar Eclipse Map
Masterminded by visual journalist Denise Lu, this eclipse map by the Washington Post is both stunning and useful — a winning data viz combination if ever there was one. The article asks for your year of birth, then displays every solar eclipse in your lifetime (provided you live to 100). How does it do this? On the globe, of course.

What by rights should appear extremely complicated is here made simple and intuitive. As is typical of the very best uses of data visualization, you wonder how or why anyone would ever want to present the same information another way. And the globe screenshotted above is just the tip of the iceberg. The article goes on to explore all sorts of fascinating stuff — from degrees of eclipse to the path of totality.
IMPF Dashboard
The seismic impact of the Covid pandemic has lent itself especially well to data visualization over the last couple of years. Infections, hospitalisations, deaths, reinfections, vaccinations… all this and more add up to the story of the pandemic. And that’s to say nothing of its impact on politics, economies, and culture. The amount of data available is overwhelming, but as this dashboard by the German Federal Ministry of Health shows, it can be wrangled into forms we can all understand.
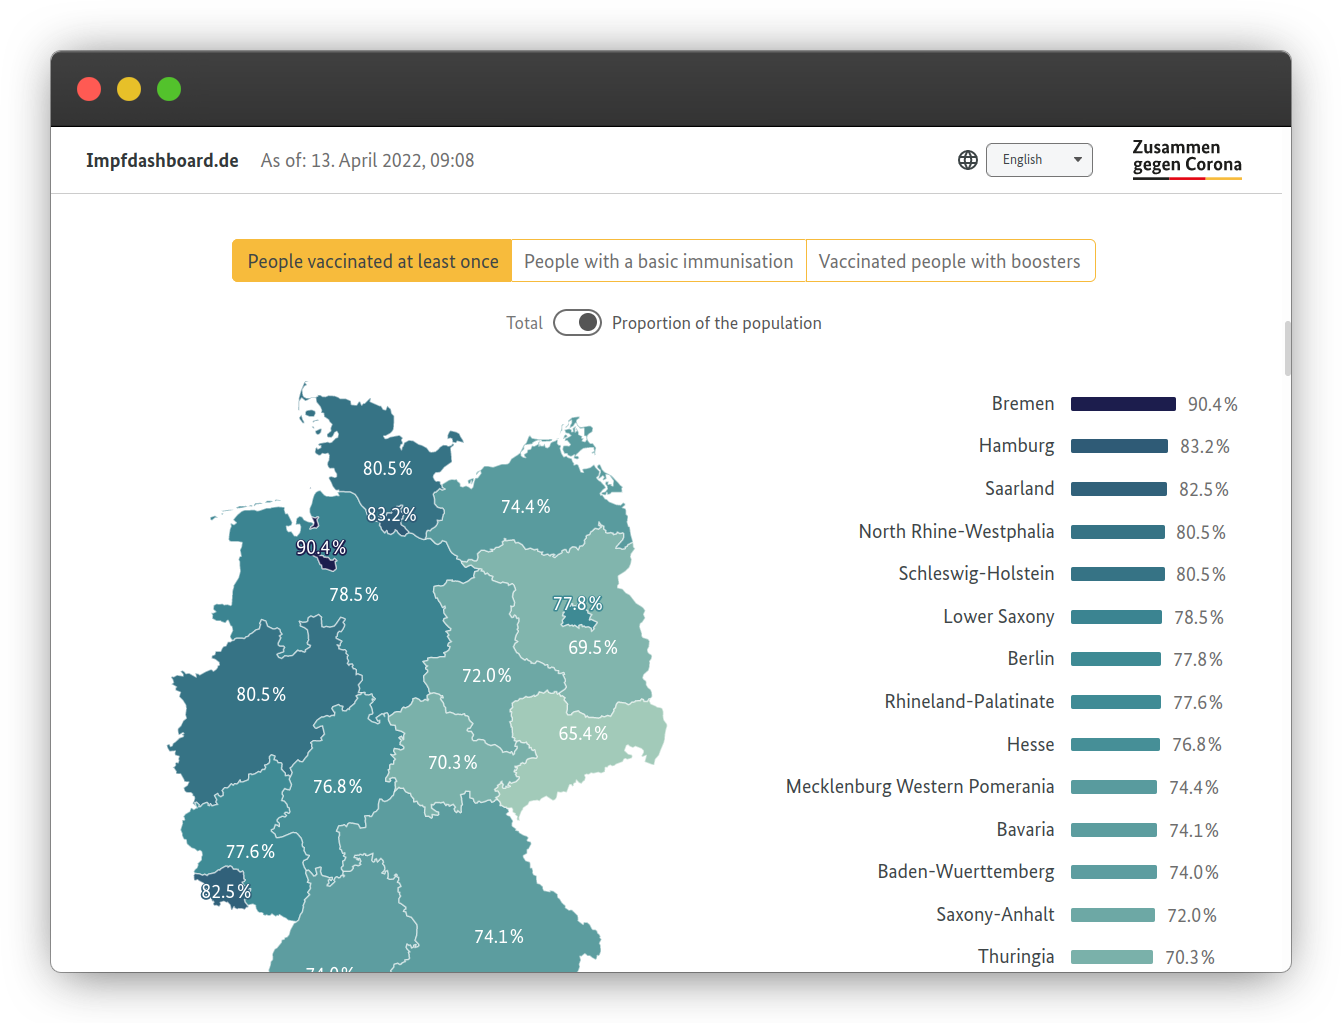
Delving into vaccination data by region, age group, and even manufacturers, the dashboard is its own little masterclass in data visualization. It’s beautifully designed too, with an appealing palette and impressive range of styles giving each visual a distinctive look and feel. Government data doesn’t have to be boring or opaque. And again, it’s all available to download.
Lunar Open Architecture
I don’t think we ever truly lose our childlike wonder for space exploration. Now more than ever humankind is reaching for the stars – but who’s doing what? And how’s it going? Lunar Open Architecture (LOA) seeks to answer those questions and a whole lot more. A collaboration between MIT Media Lab’s Space Exploration Initiative and the Open Lunar Foundation, LOA includes a stunning, outer space-like data visualization of missions since 1958.

By grouping missions together by organizations, type, and status, the constellation of nodes gives you an immediate sense of how space exploration has evolved over time — and how it’s likely to evolve in the future. As MIT put it, “the future of lunar exploration is getting crowded.” Projects like this show that fact is something the masses can and should understand. It’s not rocket science.
Nationscape Insights
There’s an awful lot of bluster around when it comes to the will of the people. Many claim to know what it is, yet seldom do they reach the same conclusions. Probably because they often don’t consult the people themselves. The Nationscape Insights project — a collaboration between the Democracy Fund Voter Study Group, UCLA, and USA Today — is an attempt to strip away the rhetoric from politics and show what voters actually think.

Containing 80 weeks of survey data collected in the build up to the 2020 US election, the Nationscapes Insights project allows you to explore public opinions on topics ranging from gun control to the Green New Deal, with filters for region, demographics, and political party. It’s a remarkable dataset. The interface is intuitive, clear, and — I think — impressively nonpartisan. The methodology is clear. You can see the questions interviewees were asked. It is data visualization that clarifies rather than clouds, and that’s always a worthy goal.
Get Your Data Viz On
The data visualization examples shared here present but a fraction of what’s possible. If a data set exists, it can be expressed in fascinating, informative ways. It just needs storytellers (who show their methodology).
In the interests of furthering data visualization everywhere, below is a selection of learning resources, libraries, articles, websites, and other resources to sink your teeth into. Explore, play, do the unexpected. Go make something beautiful.
Learning resources
Libraries
For Your Bookmarks
Further Reading
(vf, yk, il)